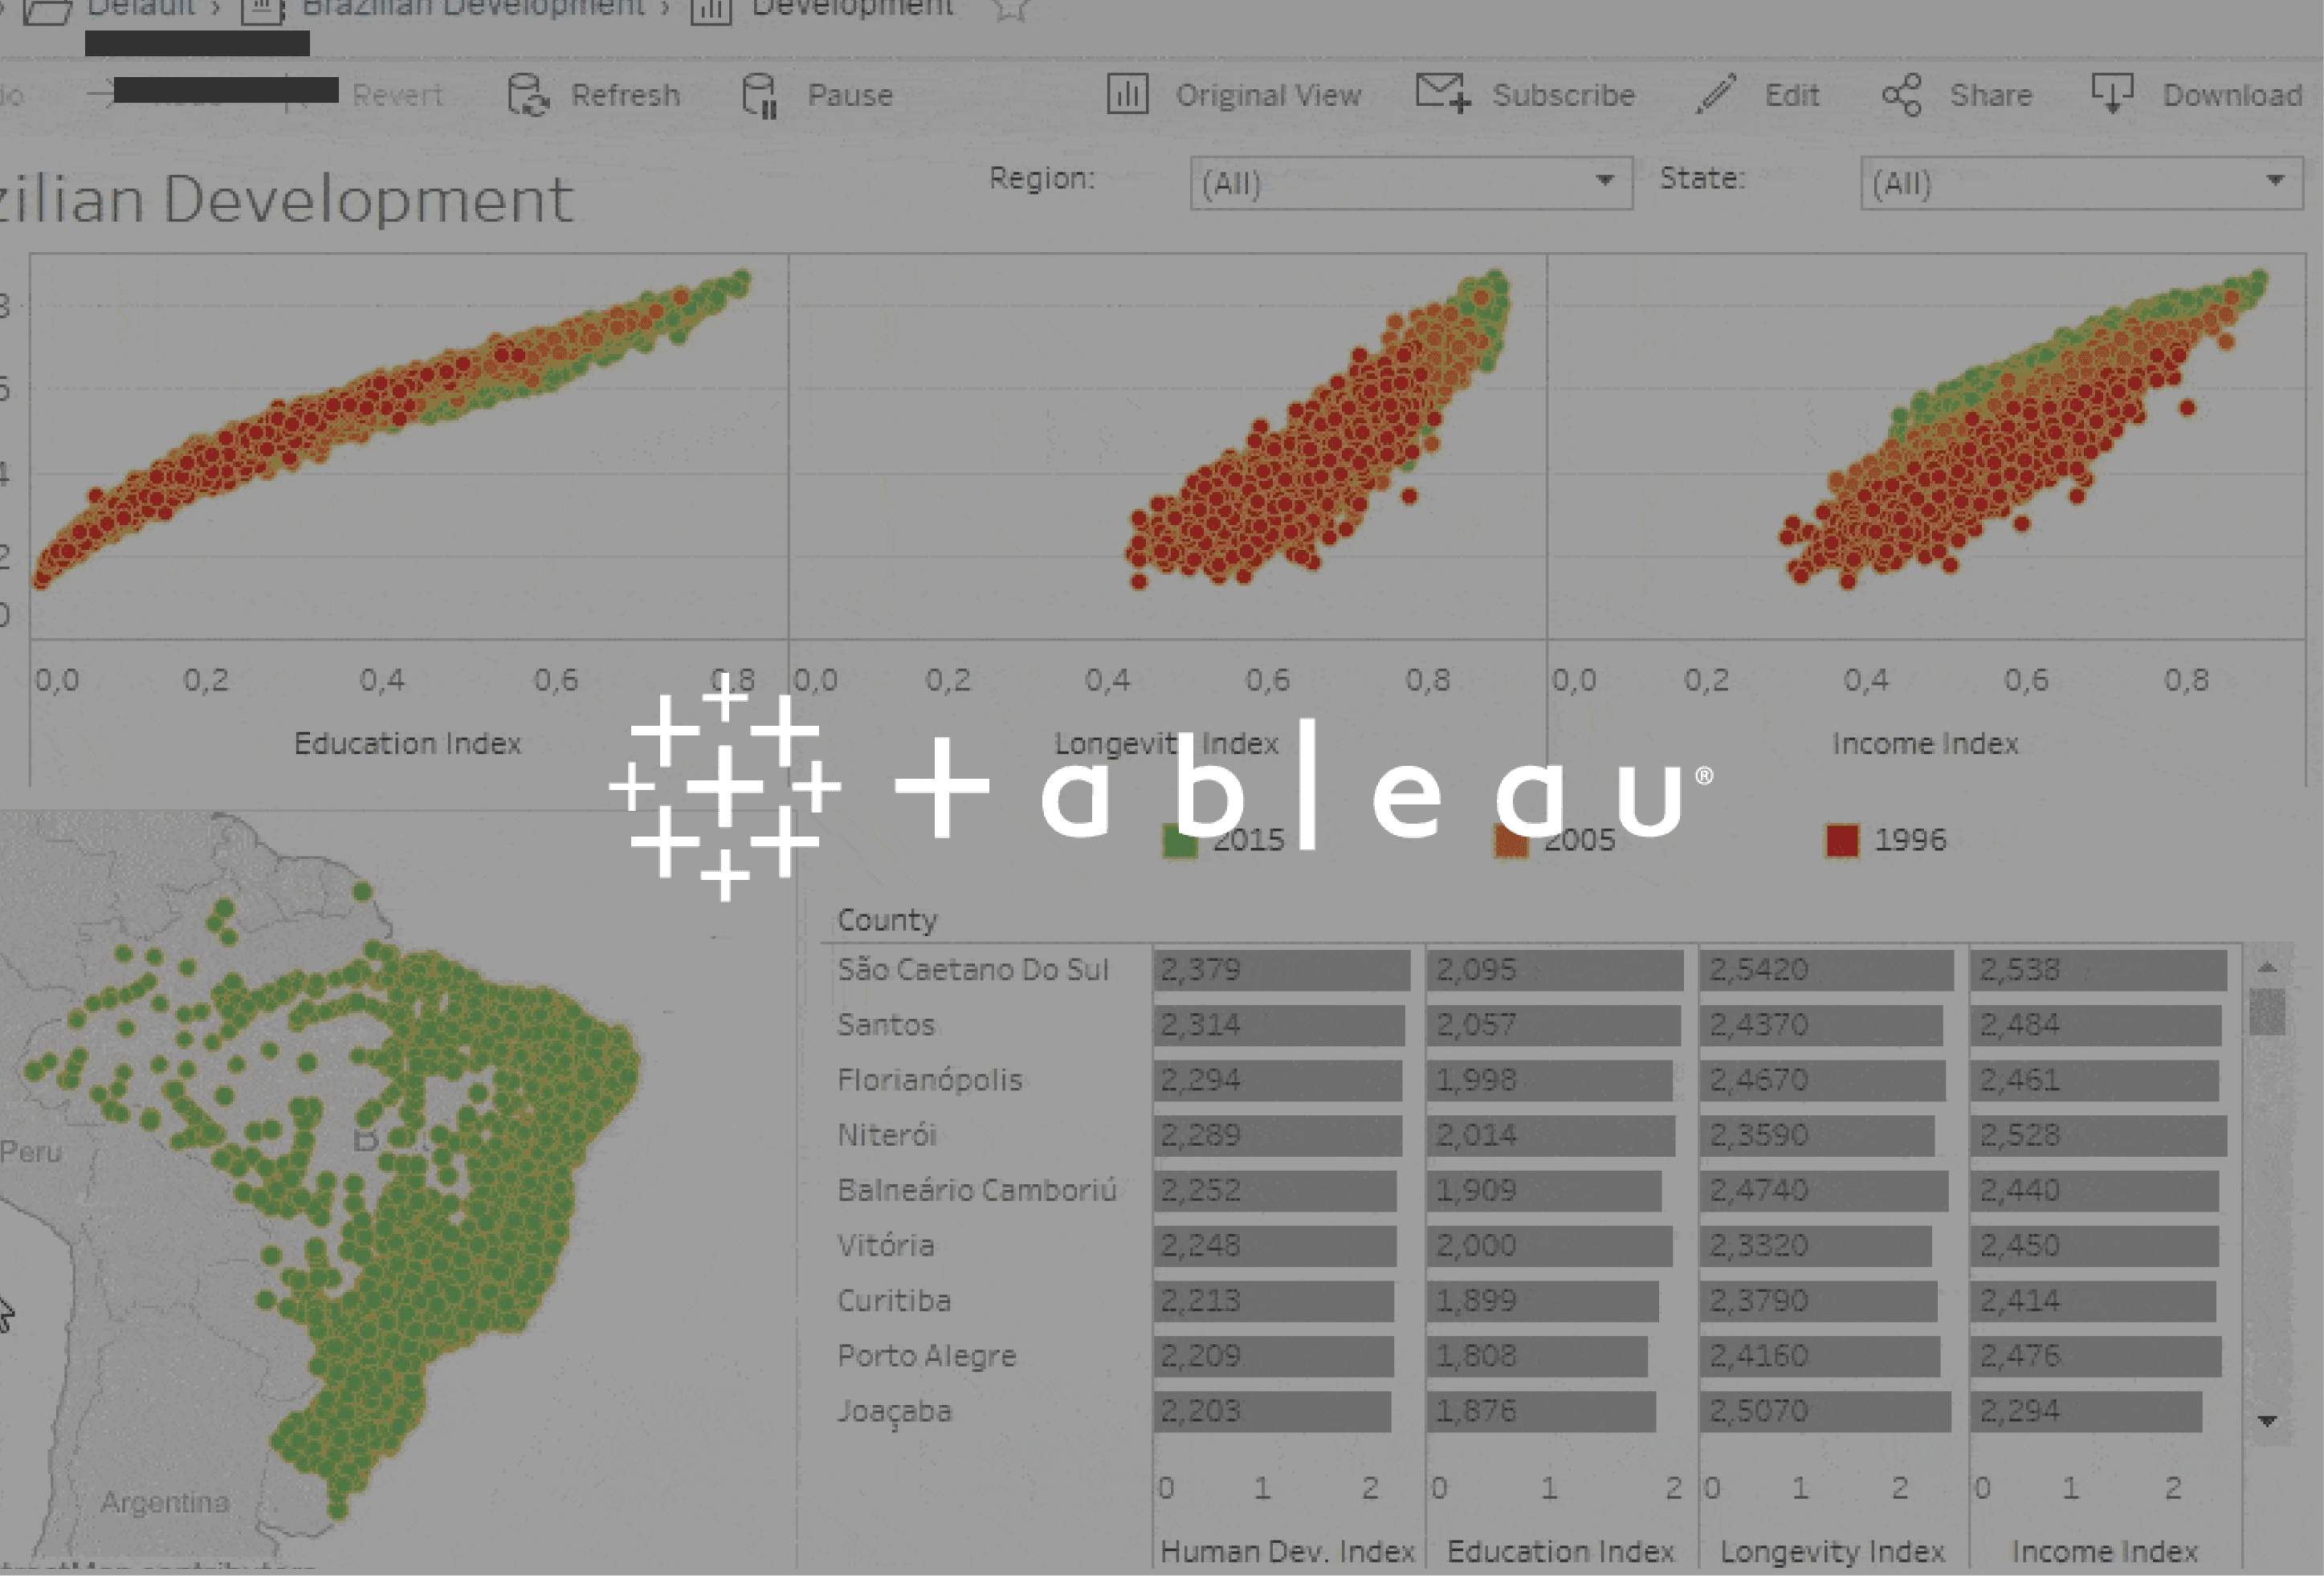
Learn the skills to turn data into compelling narratives using advanced visualization techniques. You’ll master data modeling and create interactive charts and dashboards with Tableau, effectively communicating insights that drive business decisions.
Delivery
Online & On-Campus
Age
13 to 18
What You'll Learn
Gain a foundational understanding of data analytics, learning how to collect, clean, and analyze data to uncover meaningful insights.
Explore how to structure and organize data to build models that support data analysis and visualization.
Learn how to present data visually and tell a compelling story through graphs, charts, and dashboards, enhancing your ability to communicate key insights effectively.
Get hands-on experience using Tableau to create interactive dashboards, enabling dynamic exploration of data and real-time insight generation.
Final Project
For your final project, you will design and build an interactive business dashboard using Tableau. Your dashboard will showcase your ability to clean, analyze, and visualize data, allowing users to explore data dynamically and uncover actionable insights in real-time.
Target Audience
This course is perfect for students eager to learn data analytics and data visualization techniques. No prior experience is required, though a passion for storytelling through data will enhance the experience.
Requirements
macOS 13+, Intel processor or Apple Silicon, 8GB+ RAM

